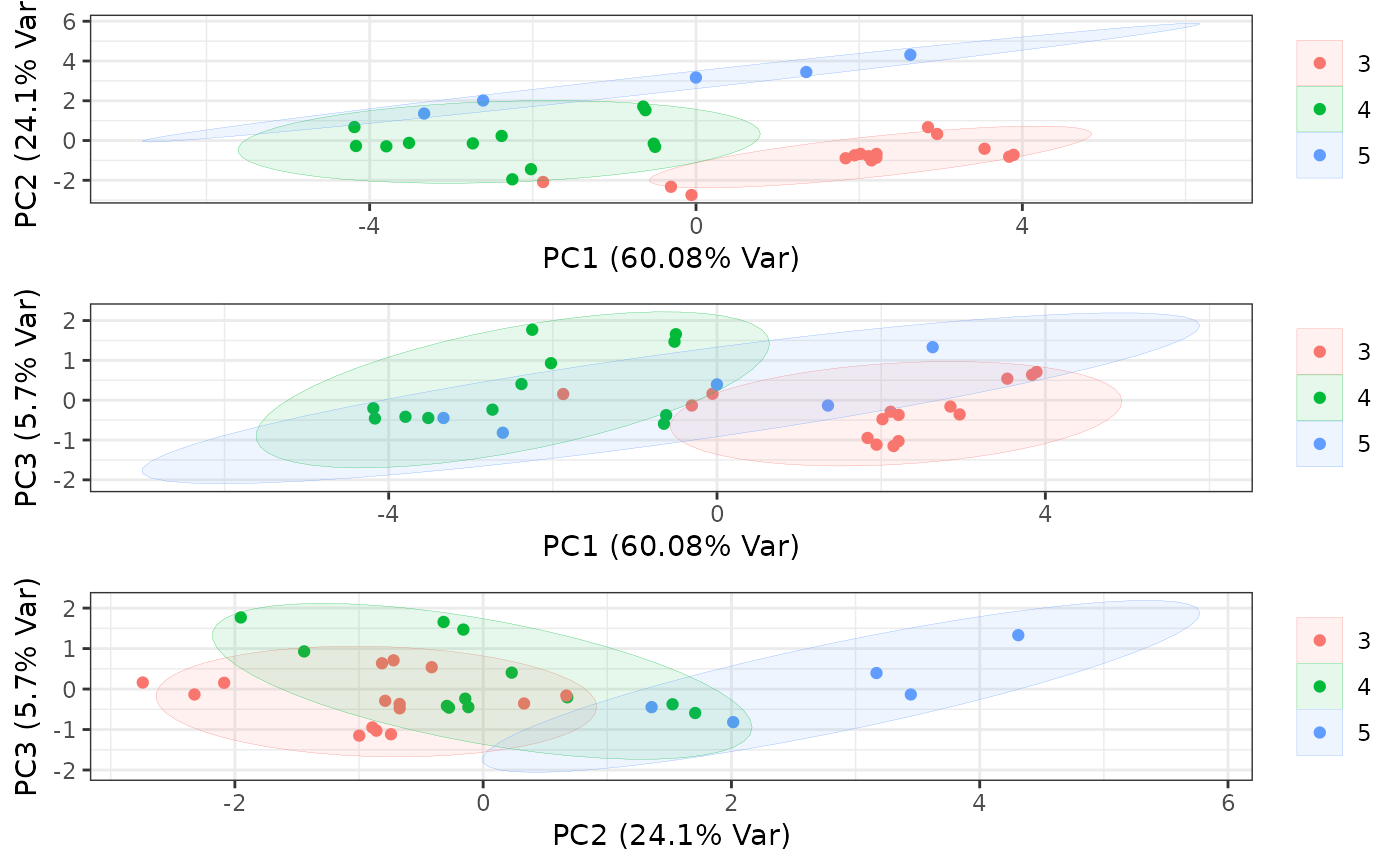
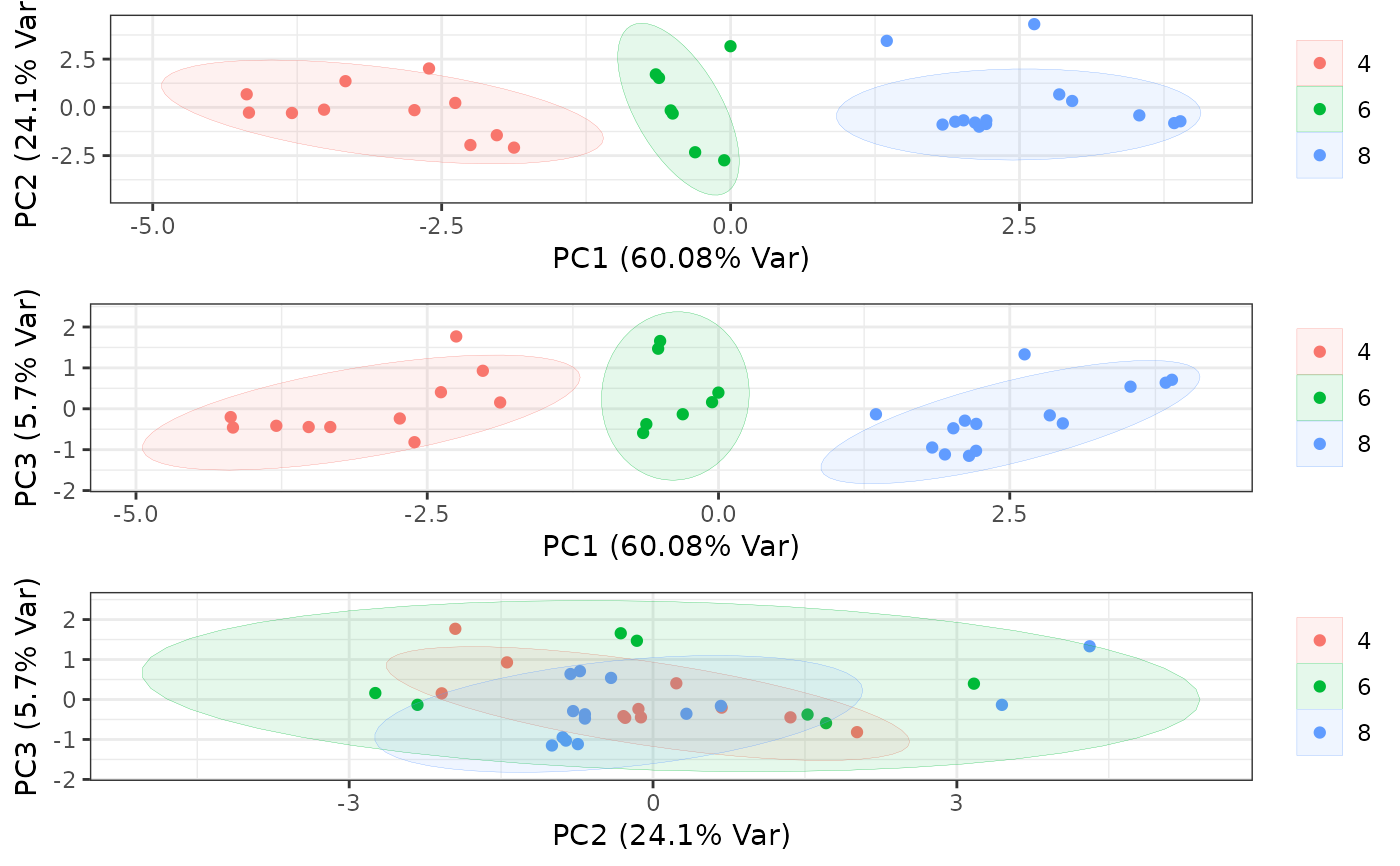
Plot the first three PCs and draw ellipses highlighting
differences in the levels of a factor
Arguments
- by
factor to plot as ellipses on PCA plots
- tdat
data matrix to compute principal components
Value
PCA plots for every combination of PC1, PC2, and PC3. The
percentage of variation contribution is shown in the axes labels.
Author
Aline Talhouk, Derek Chiu
Examples
PCAplot(mtcars$cyl, mtcars)

PCAplot(mtcars$gear, mtcars)