Generates barplot on variables and shows counts per group.
Usage
doBarplot(data, var, xlab = var, ylab = "Frequency", title = NULL, digits = 3)
Arguments
- data
data.frame with column names
- var
string of variable in data to graph on
- xlab
x-axis label
- ylab
y-axis label
- title
barplot title
- digits
number of digits to round to
Value
Barplot of frequencies for each group
Details
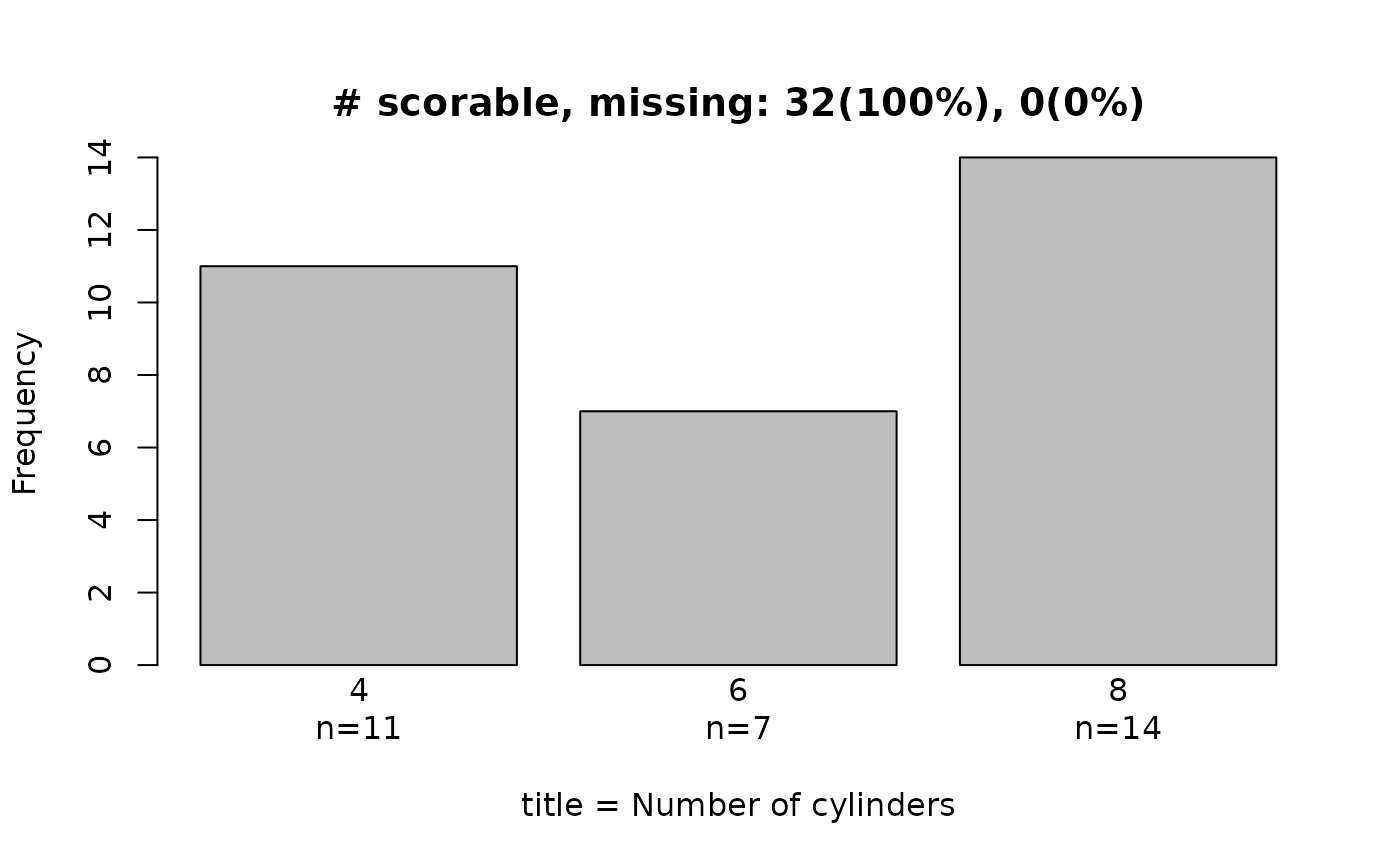
The number of data points in each group is reported.
The number of scorable and missing data are also reported by number
and percentage in the barplot title.
Note
Function expects missing to be NA. Do not filter out missing data
as this function reports missing data frequencies.
Author
Samuel Leung, Derek Chiu
Examples
doBarplot(mtcars, "cyl", "title = Number of cylinders")

doBarplot(mtcars, "cyl", "Cylinders", title = "Number of cylinders")
