Do a boxplot among subtypes
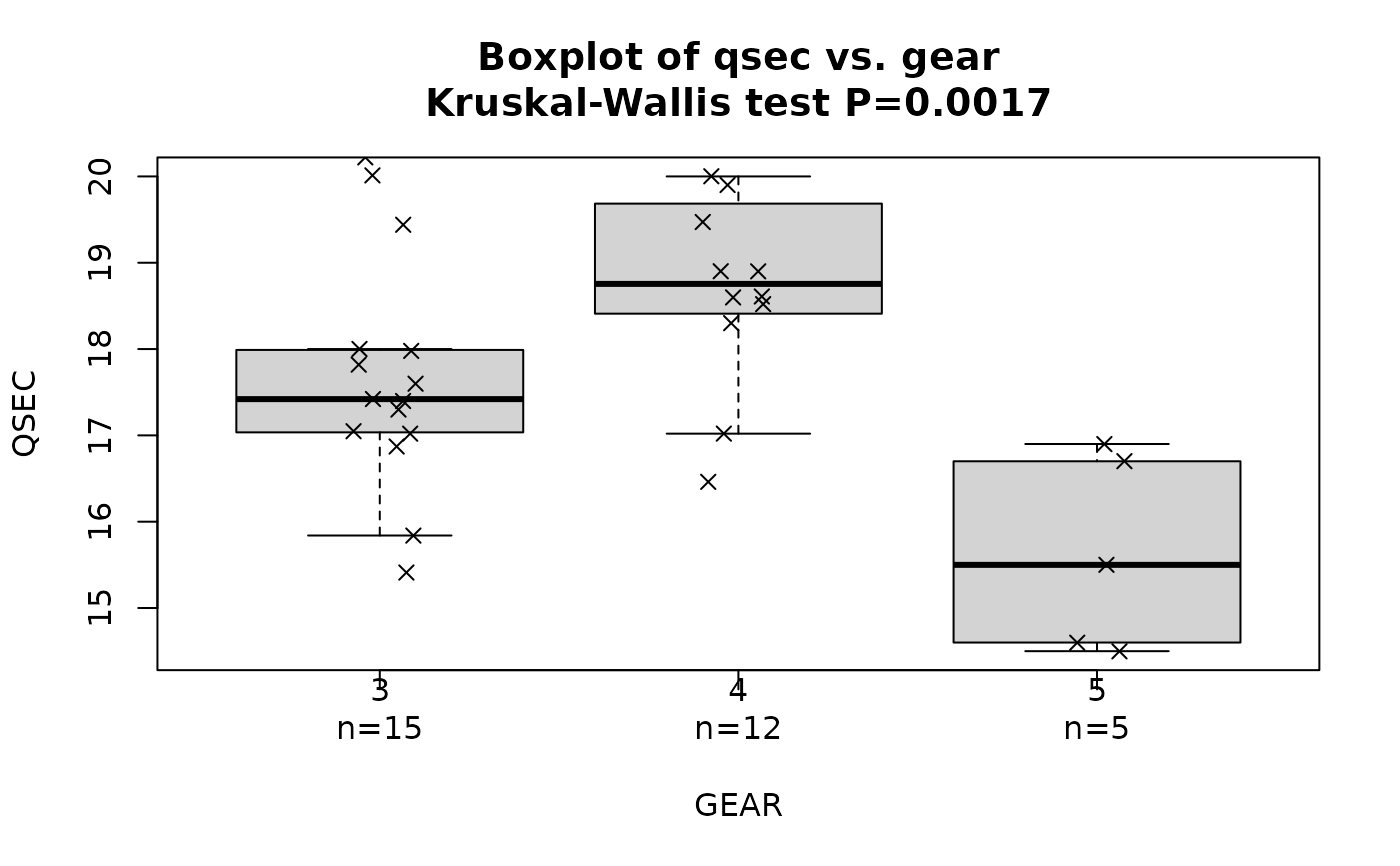
doBoxplotAmongSubtypes.RdA stripchart (jitter plot) of a biomarker and some categorical subtype is superimposed on top of the boxplot
Usage
doBoxplotAmongSubtypes(
  input.d,
  data.description,
  biomarker.var.name,
  biomarker.name,
  subtype.var.name,
  subtype.name,
  pch = 4,
  jitter = 0.1,
  digits = 2,
  ...
)
Arguments
- input.d
input data.frame
- data.description
boxplot title description
- biomarker.var.name
biomarker variable name in
input.dto graph on- biomarker.name
boxplot y-axis label
- subtype.var.name
subtype variable name in
input.dto graph on- subtype.name
boxplot x-axis label
- pch
stripchart plot style
- jitter
amount of jitter in stripchart
- digits
number of digits to round to
- ...
additional arguments to
boxplot