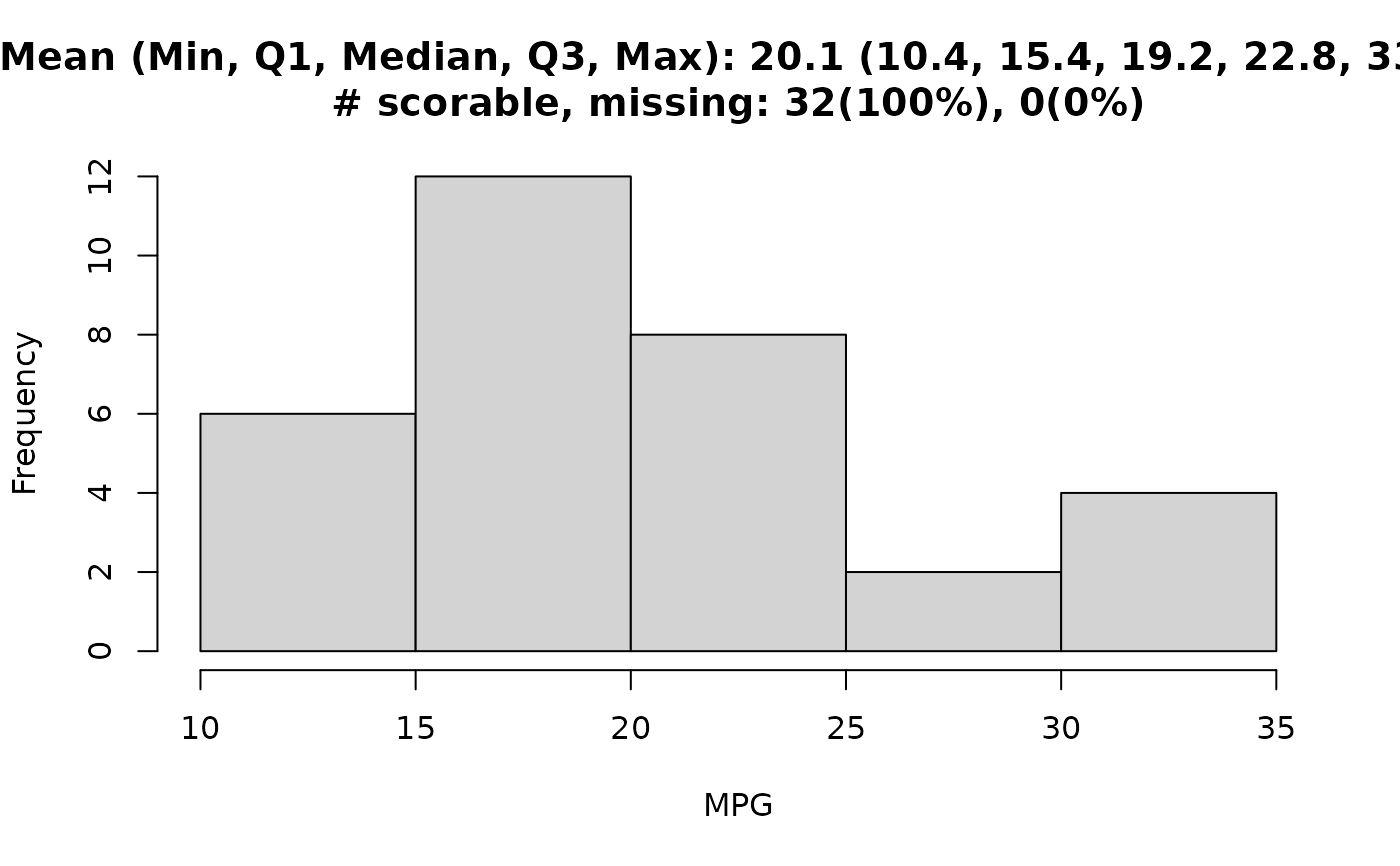
Do histogram with median
doHist.RdPlot a histogram with the median, first quartile, and third quartile reported.
Arguments
- data
data.frame with column names
- var
string of variable in
datato graph on- xlab
x-axis label
- title
histogram title
- show.title
logical. If
TRUE(default), the title is shown- br
breaks in histogram. By default, the number of bins is taking as the ceiling of the square root of the number of rows in
data- digits
number of digits to round for median, Q1, Q3
- score.lab
label for non-missing cases
- ...
additional arguments to
hist