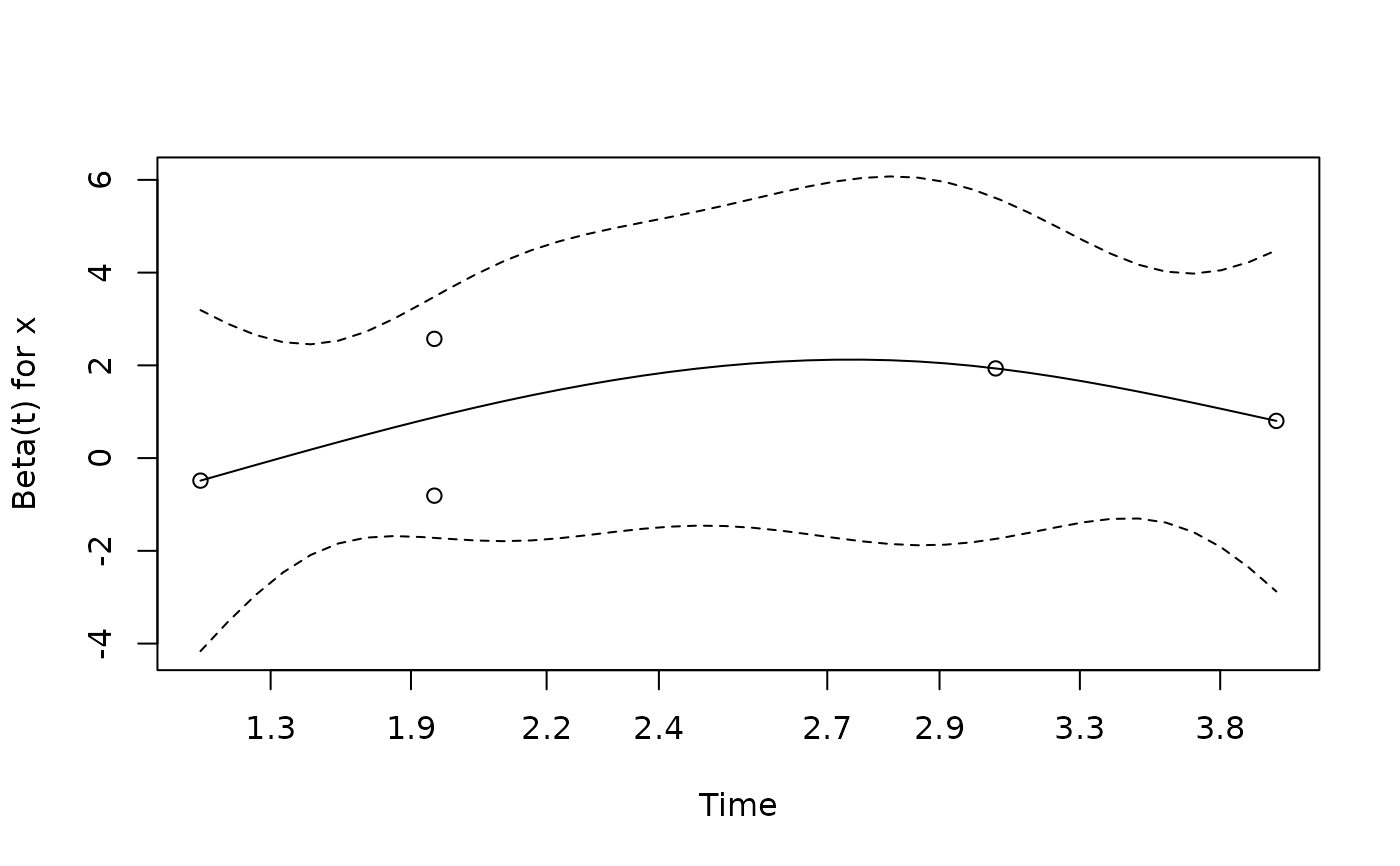
Do Schoenfeld residual plot
plotSchoenfeld.RdDo Schoenfeld residual plot
Examples
# Base output
test1 <- list(time = c(4, 3, 1, 1, 2, 2, 3),
status = c(1, 1, 1, 0, 1, 1, 0),
x = c(0, 2, 1, 1, 1, 0, 0),
sex = c(0, 0, 0, 0, 1, 1, 1))

# Pretty output
plotSchoenfeld(test1, Surv(time, status) ~ x + strata(sex), "x")

#> $fit
#> Call:
#> coxph(formula = get(".my.formula"), data = get(".my.data"))
#>
#>     coef exp(coef) se(coef)     z     p
#> x 0.8023    2.2307   0.8224 0.976 0.329
#>
#> Likelihood ratio test=1.09  on 1 df, p=0.2971
#> n= 7, number of events= 5
#>
#> $fit.zph
#>        chisq df   p
#> x      0.456  1 0.5
#> GLOBAL 0.456  1 0.5
#>
#> $fit
#> Call:
#> coxph(formula = get(".my.formula"), data = get(".my.data"))
#>
#> coef exp(coef) se(coef) z p
#> x 0.8023 2.2307 0.8224 0.976 0.329
#>
#> Likelihood ratio test=1.09 on 1 df, p=0.2971
#> n= 7, number of events= 5
#>
#> $fit.zph
#> chisq df p
#> x 0.456 1 0.5
#> GLOBAL 0.456 1 0.5
#>