| Variable | Levels | CS3 | CS1 | CS2 | Total |
|---|---|---|---|---|---|
| Selected Cohorts | |||||
| Histotype | HGSOC | 1808 (78%) | 128 (47%) | 655 (78%) | 2591 (75%) |
| CCOC | 164 (7%) | 48 (18%) | 62 (7%) | 274 (8%) | |
| ENOC | 250 (11%) | 60 (22%) | 49 (6%) | 359 (10%) | |
| MUOC | 68 (3%) | 17 (6%) | 58 (7%) | 143 (4%) | |
| LGSOC | 36 (2%) | 19 (7%) | 20 (2%) | 75 (2%) | |
| Missing | 151 | 22 | 59 | 232 | |
| Total | N (%) | 2477 (67%) | 294 (8%) | 903 (25%) | 3674 (100%) |
| QC | |||||
| Histotype | HGSOC | 1676 (78%) | 122 (46%) | 641 (78%) | 2439 (75%) |
| CCOC | 158 (7%) | 48 (18%) | 62 (8%) | 268 (8%) | |
| ENOC | 213 (10%) | 60 (23%) | 47 (6%) | 320 (10%) | |
| MUOC | 65 (3%) | 16 (6%) | 56 (7%) | 137 (4%) | |
| LGSOC | 36 (2%) | 18 (7%) | 20 (2%) | 74 (2%) | |
| Missing | 125 | 22 | 56 | 203 | |
| Total | N (%) | 2273 (66%) | 286 (8%) | 882 (26%) | 3441 (100%) |
| Main Histotypes | |||||
| Histotype | HGSOC | 1676 (78%) | 122 (46%) | 641 (78%) | 2439 (75%) |
| CCOC | 158 (7%) | 48 (18%) | 62 (8%) | 268 (8%) | |
| ENOC | 213 (10%) | 60 (23%) | 47 (6%) | 320 (10%) | |
| MUOC | 65 (3%) | 16 (6%) | 56 (7%) | 137 (4%) | |
| LGSOC | 36 (2%) | 18 (7%) | 20 (2%) | 74 (2%) | |
| Total | N (%) | 2148 (66%) | 264 (8%) | 826 (26%) | 3238 (100%) |
| Removed Duplicates | |||||
| Histotype | HGSOC | 1578 (78%) | 118 (48%) | 623 (78%) | 2319 (76%) |
| CCOC | 146 (7%) | 45 (18%) | 56 (7%) | 247 (8%) | |
| ENOC | 200 (10%) | 56 (23%) | 43 (5%) | 299 (10%) | |
| MUOC | 55 (3%) | 13 (5%) | 54 (7%) | 122 (4%) | |
| LGSOC | 32 (2%) | 14 (6%) | 19 (2%) | 65 (2%) | |
| Total | N (%) | 2011 (66%) | 246 (8%) | 795 (26%) | 3052 (100%) |
| Normalized and Recombined | |||||
| Histotype | HGSOC | 454 (97%) | 117 (49%) | 622 (79%) | 1193 (79%) |
| CCOC | 4 (1%) | 44 (18%) | 55 (7%) | 103 (7%) | |
| ENOC | 4 (1%) | 55 (23%) | 42 (5%) | 101 (7%) | |
| MUOC | 4 (1%) | 12 (5%) | 53 (7%) | 69 (5%) | |
| LGSOC | 4 (1%) | 13 (5%) | 18 (2%) | 35 (2%) | |
| Total | N (%) | 470 (31%) | 241 (16%) | 790 (53%) | 1501 (100%) |
| Removed Replicates | |||||
| Histotype | HGSOC | 454 (97%) | 9 (12%) | 552 (78%) | 1015 (81%) |
| CCOC | 4 (1%) | 24 (31%) | 53 (7%) | 81 (6%) | |
| ENOC | 4 (1%) | 38 (49%) | 40 (6%) | 82 (7%) | |
| MUOC | 4 (1%) | 3 (4%) | 50 (7%) | 57 (5%) | |
| LGSOC | 4 (1%) | 3 (4%) | 15 (2%) | 22 (2%) | |
| Total | N (%) | 470 (37%) | 77 (6%) | 710 (56%) | 1257 (100%) |
3 Distributions
3.1 Histotype Distribution
| Variable | Levels | Training | Confirmation | Validation |
|---|---|---|---|---|
| Histotype | CCOC | 81 (50%) | 72 (40%) | 69 (44%) |
| ENOC | 82 (50%) | 107 (60%) | 88 (56%) | |
| Missing | 1094 | 463 | 737 | |
| Total | N (%) | 1257 (45%) | 642 (23%) | 894 (32%) |
3.2 Cohort Distribution
| CodeSet | CS1 N = 294 |
CS2 N = 903 |
CS3 N = 2,477 |
|---|---|---|---|
| Cohort | |||
| OOU | 108 (37%) | 43 (4.8%) | 19 (0.8%) |
| OOUE | 32 (11%) | 30 (3.3%) | 11 (0.4%) |
| VOA | 145 (49%) | 122 (14%) | 538 (22%) |
| OVAR3 | 0 (0%) | 150 (17%) | 0 (0%) |
| OVAR11 | 0 (0%) | 416 (46%) | 0 (0%) |
| MAYO | 6 (2.0%) | 63 (7.0%) | 0 (0%) |
| DOVE4 | 0 (0%) | 0 (0%) | 1,160 (47%) |
| TNCO | 0 (0%) | 0 (0%) | 691 (28%) |
| MTL | 3 (1.0%) | 59 (6.5%) | 0 (0%) |
| JAPAN | 0 (0%) | 8 (0.9%) | 0 (0%) |
| POOL-CTRL | 0 (0%) | 12 (1.3%) | 0 (0%) |
| POOL-1 | 0 (0%) | 0 (0%) | 31 (1.3%) |
| POOL-2 | 0 (0%) | 0 (0%) | 14 (0.6%) |
| POOL-3 | 0 (0%) | 0 (0%) | 13 (0.5%) |
| 1 n (%) |
3.3 Tissue Source
| Data | Cohort | FFPE | Frozen |
|---|---|---|---|
| Training | OVAR11 | 365 | 0 |
| JAPAN | 0 | 8 | |
| MAYO | 56 | 0 | |
| MTL | 19 | 41 | |
| OOU | 98 | 0 | |
| OOUE | 30 | 0 | |
| OVAR3 | 135 | 0 | |
| VOA | 494 | 11 | |
| Confirmation | TNCO | 642 | 0 |
| Validation | DOVE4 | 894 | 0 |
3.4 Quality Control
3.4.1 Failed Samples
We use an aggregated QCFlag that considers a sample to have failed QC if any of the following QC conditions are flagged:
- Linearity
- Imaging
- Smallest Positive Control
- Normality
| Quality Control Flag | Training N = 1,753 |
Confirmation N = 691 |
Validation N = 1,160 |
Total N = 3,604 |
|---|---|---|---|---|
| Linearity | 4 (0.2%) | 0 (0%) | 0 (0%) | 4 (0.1%) |
| Imaging | 3 (0.2%) | 0 (0%) | 4 (0.3%) | 7 (0.2%) |
| Smallest Positive Control | 2 (0.1%) | 0 (0%) | 0 (0%) | 2 (<0.1%) |
| Normality | 26 (1.5%) | 1 (0.1%) | 197 (17%) | 224 (6.2%) |
| Overall QC | 31 (1.8%) | 1 (0.1%) | 201 (17%) | 233 (6.5%) |
| 1 n (%) |
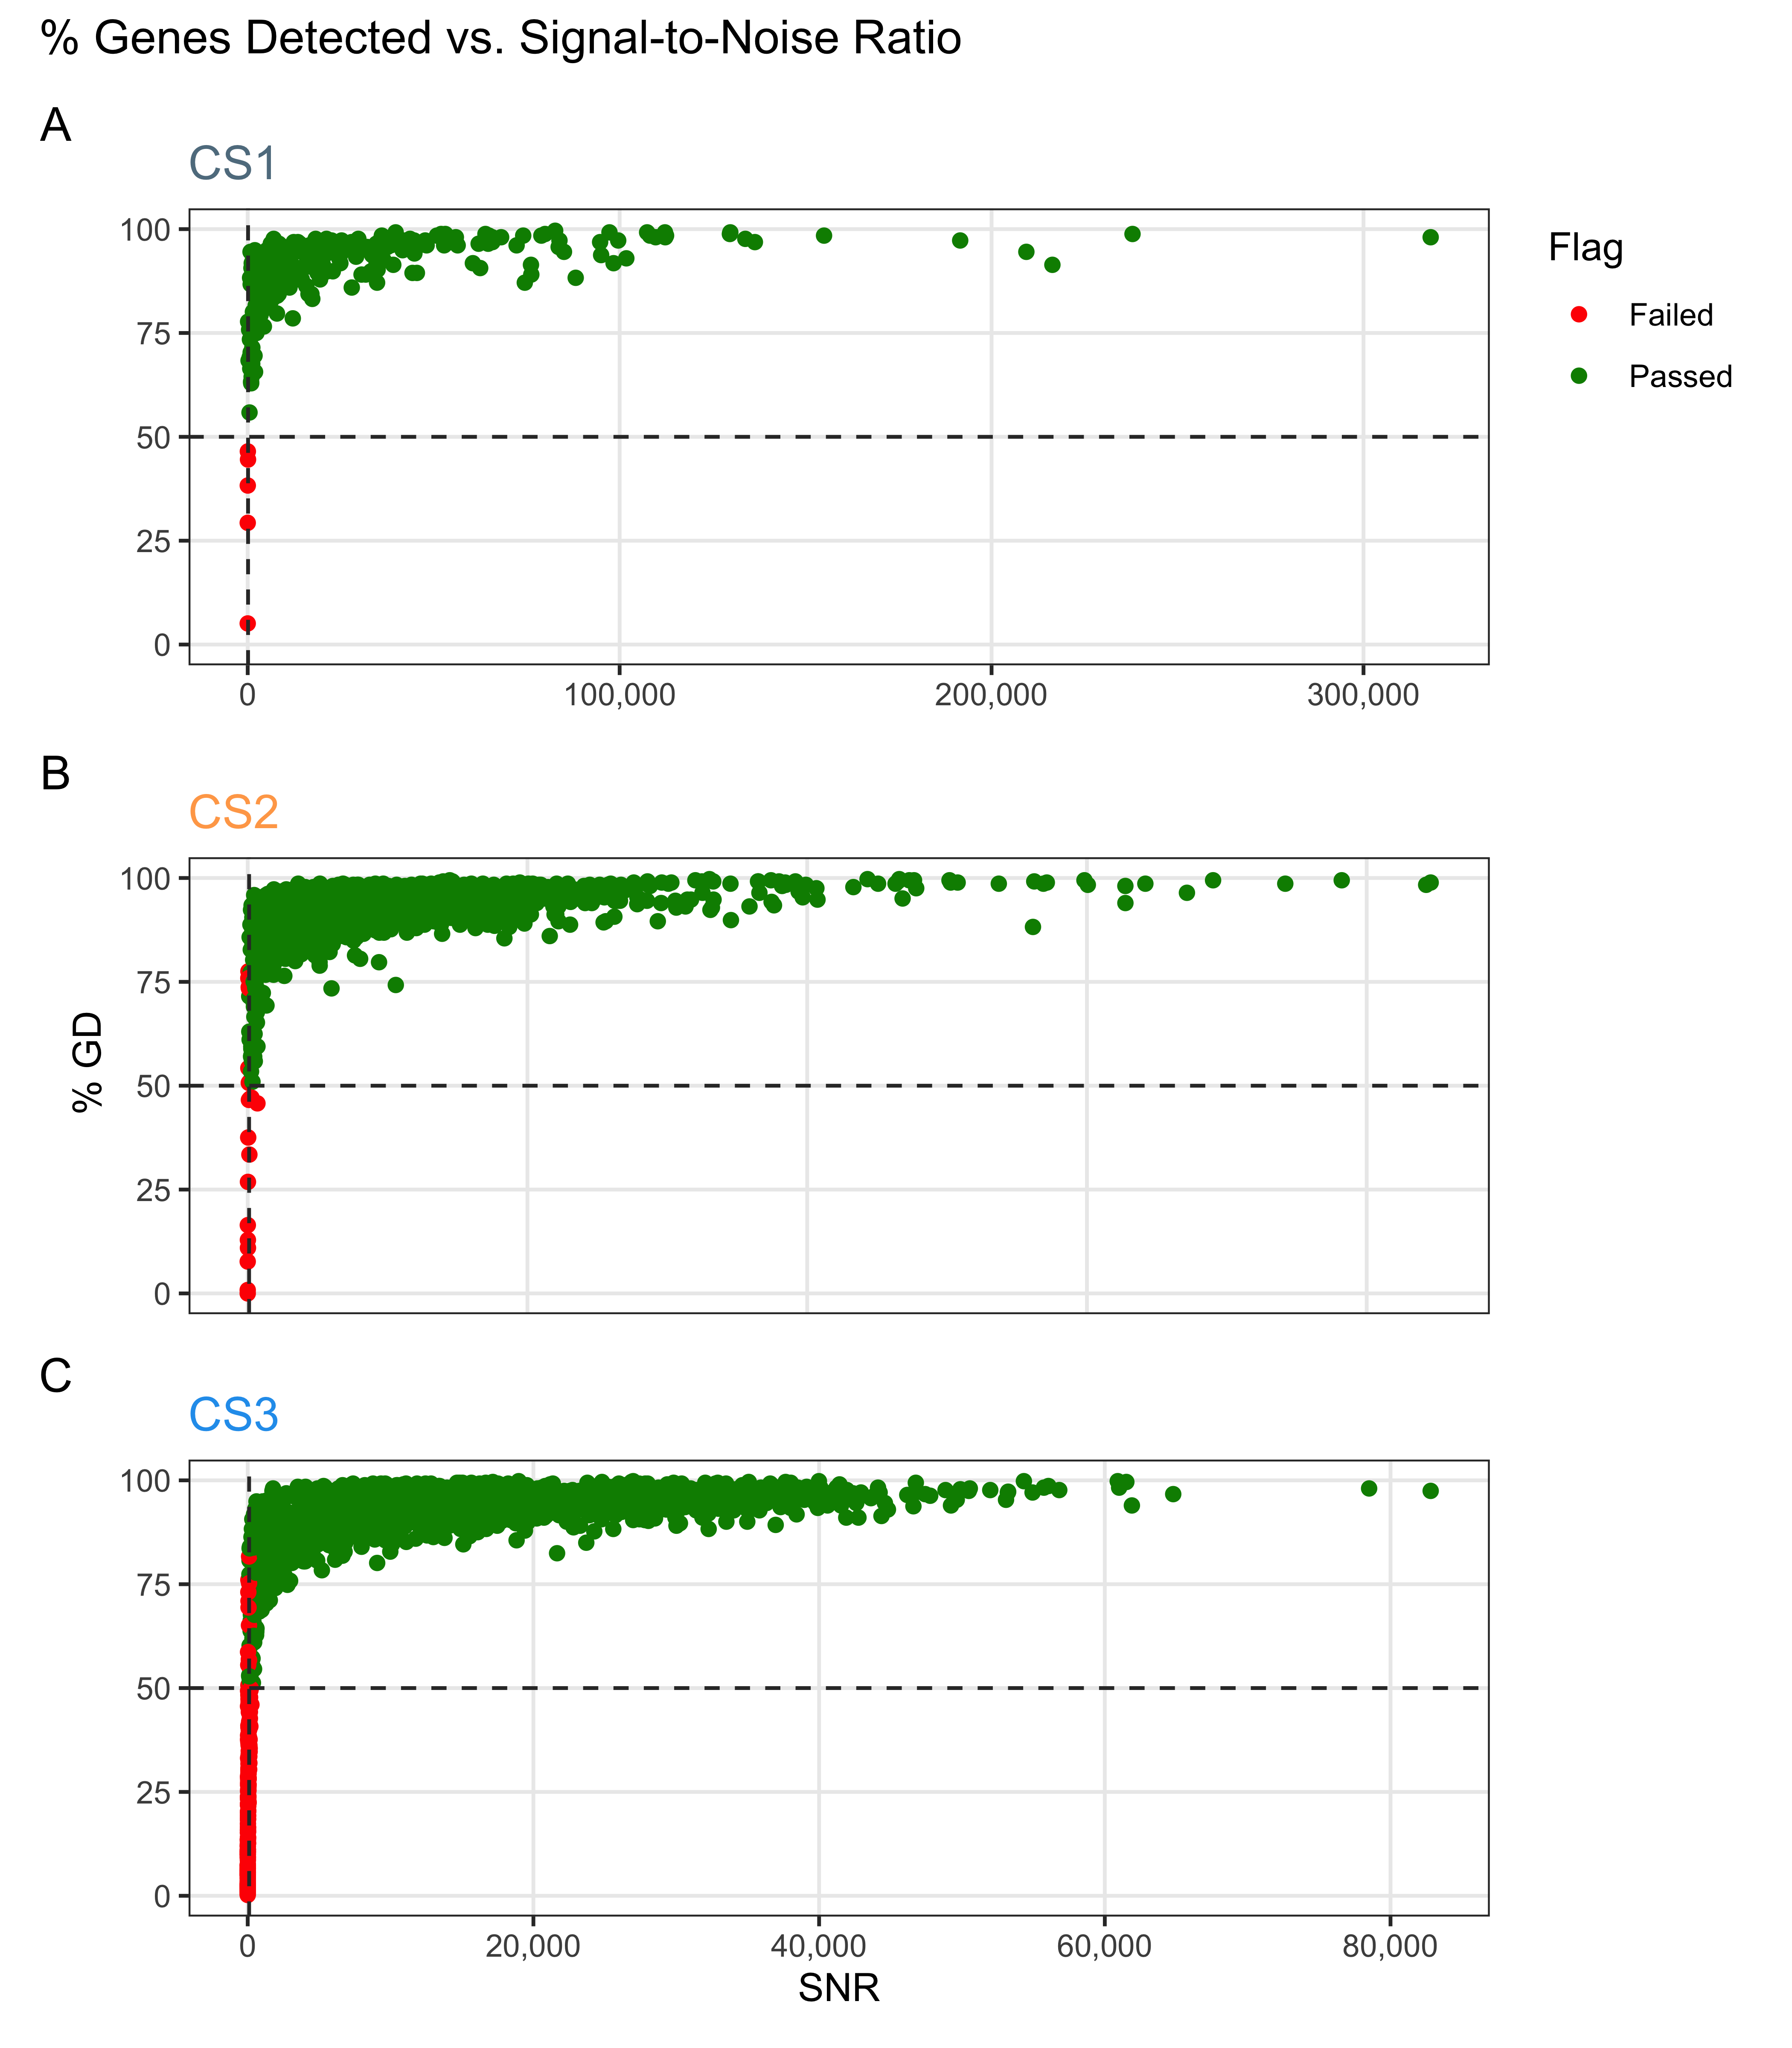
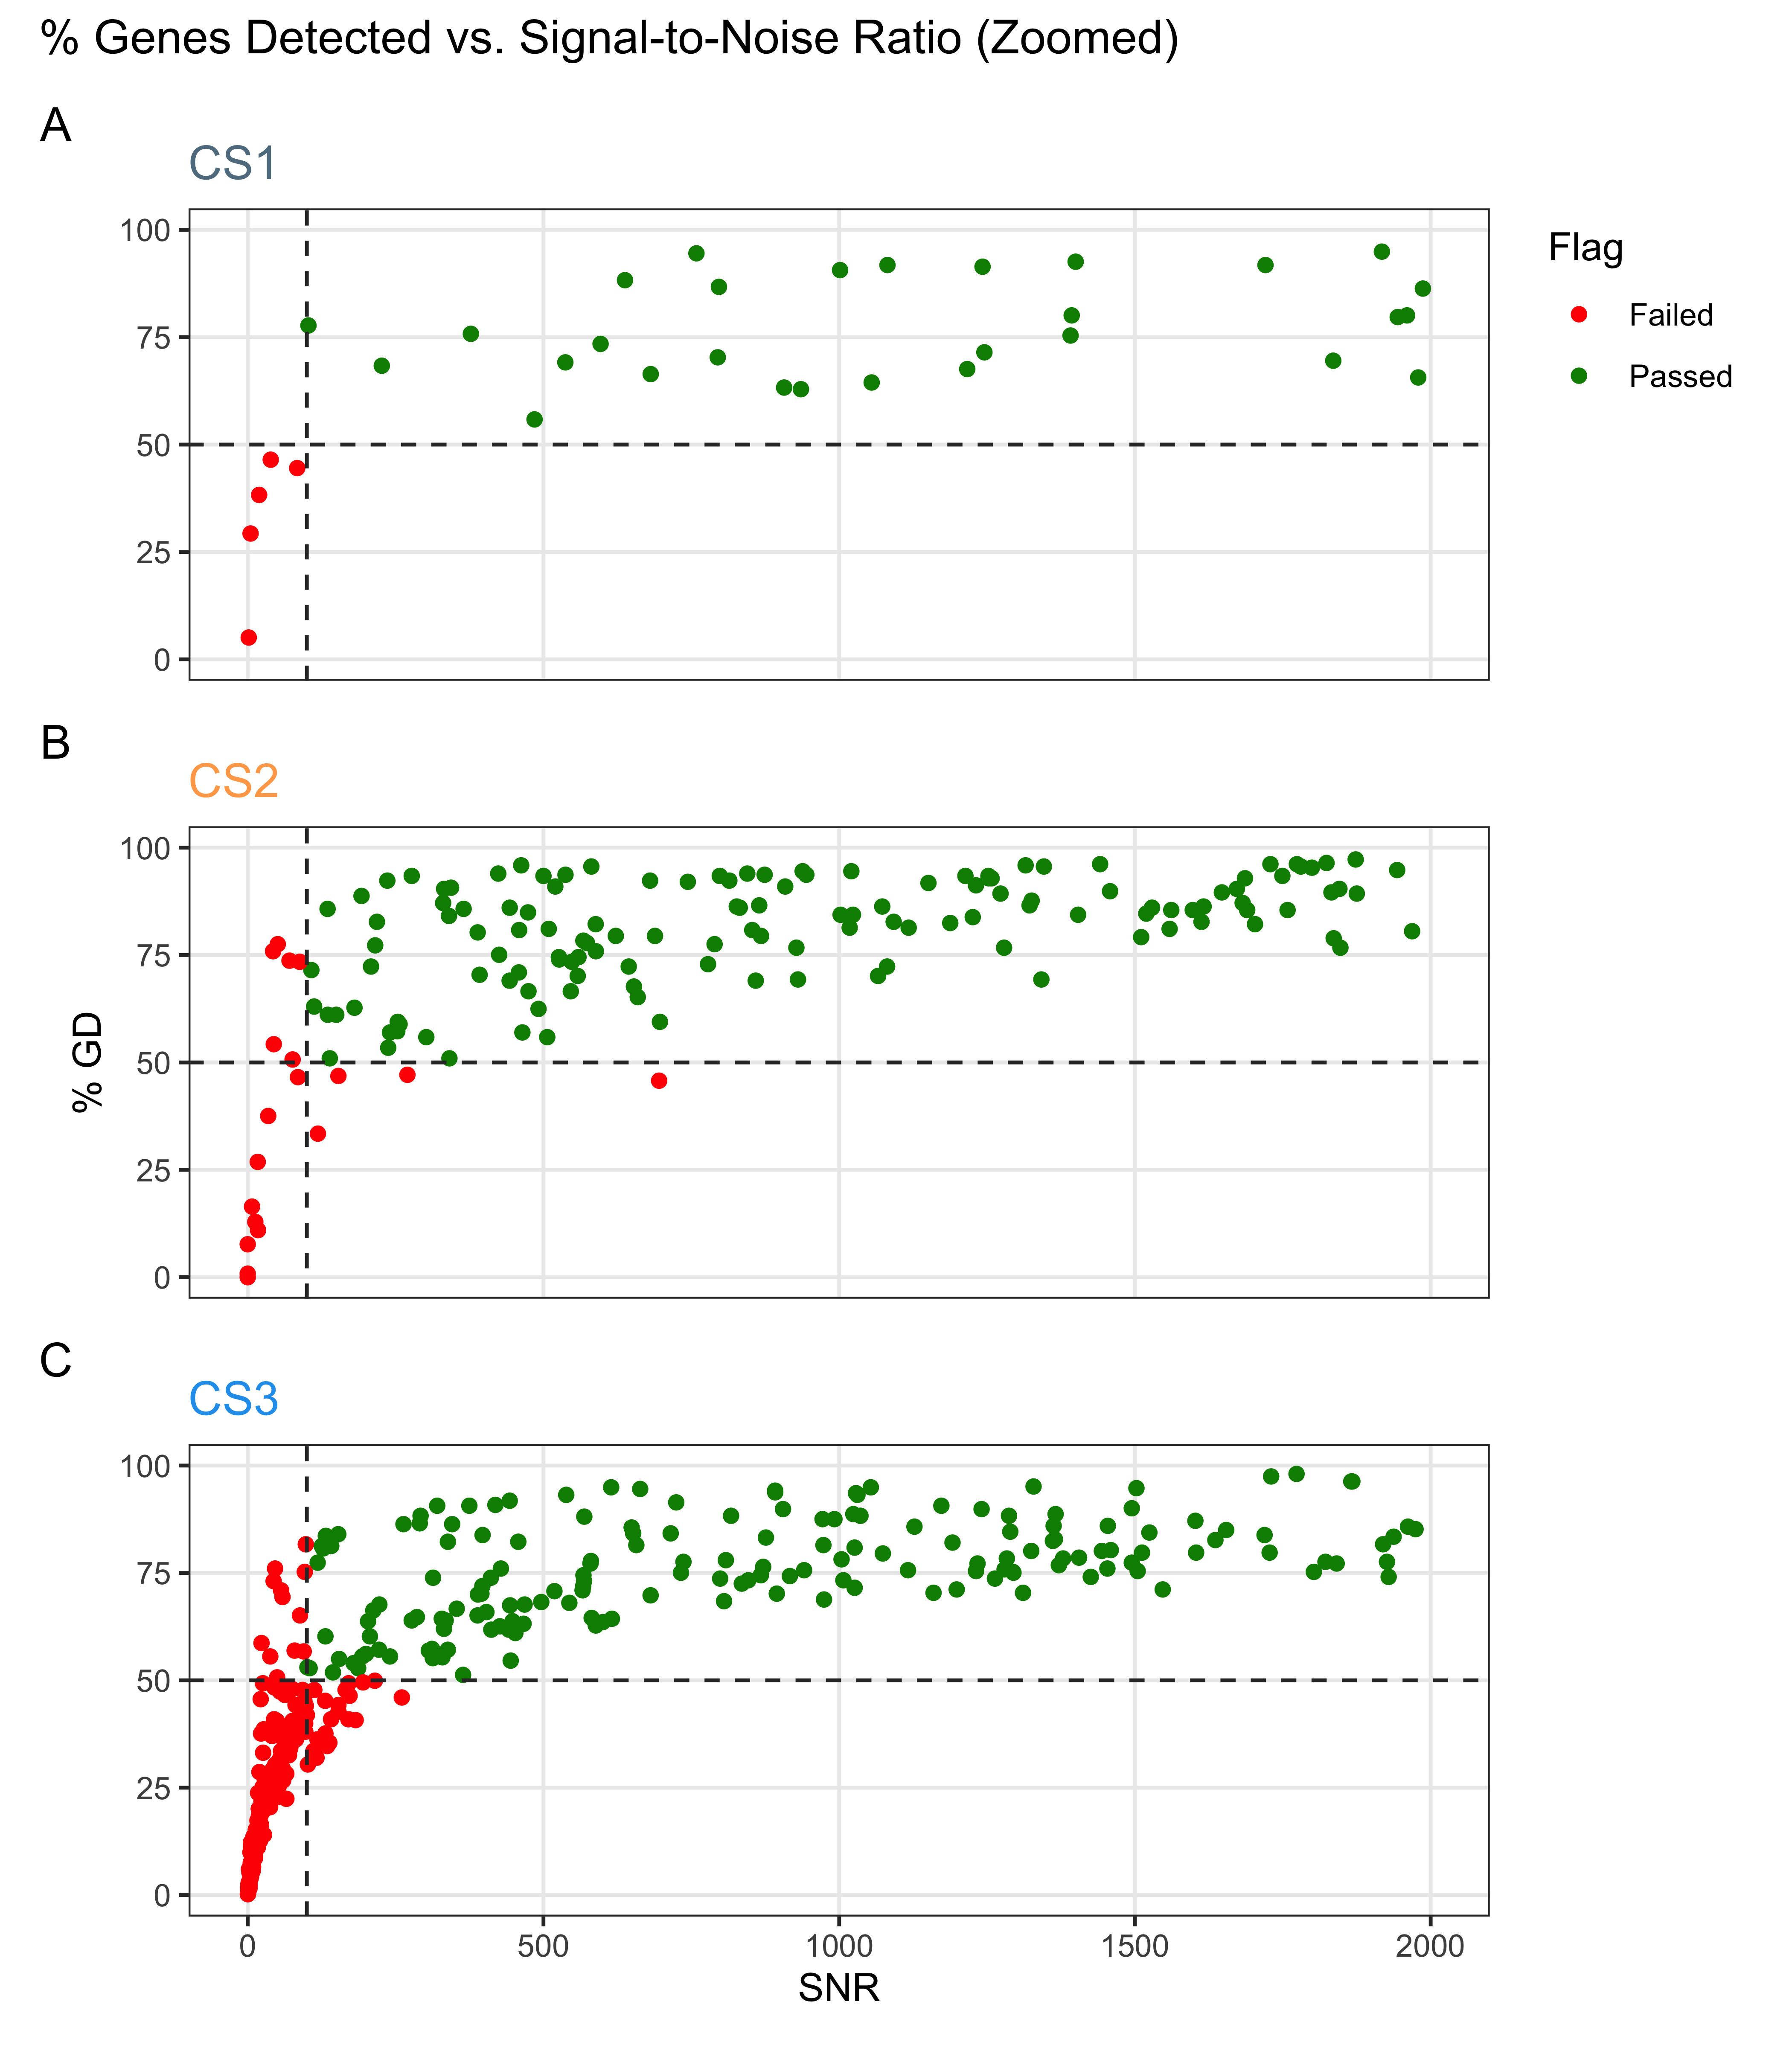
3.4.2 %GD vs. SNR
3.5 Pairwise Gene Expression
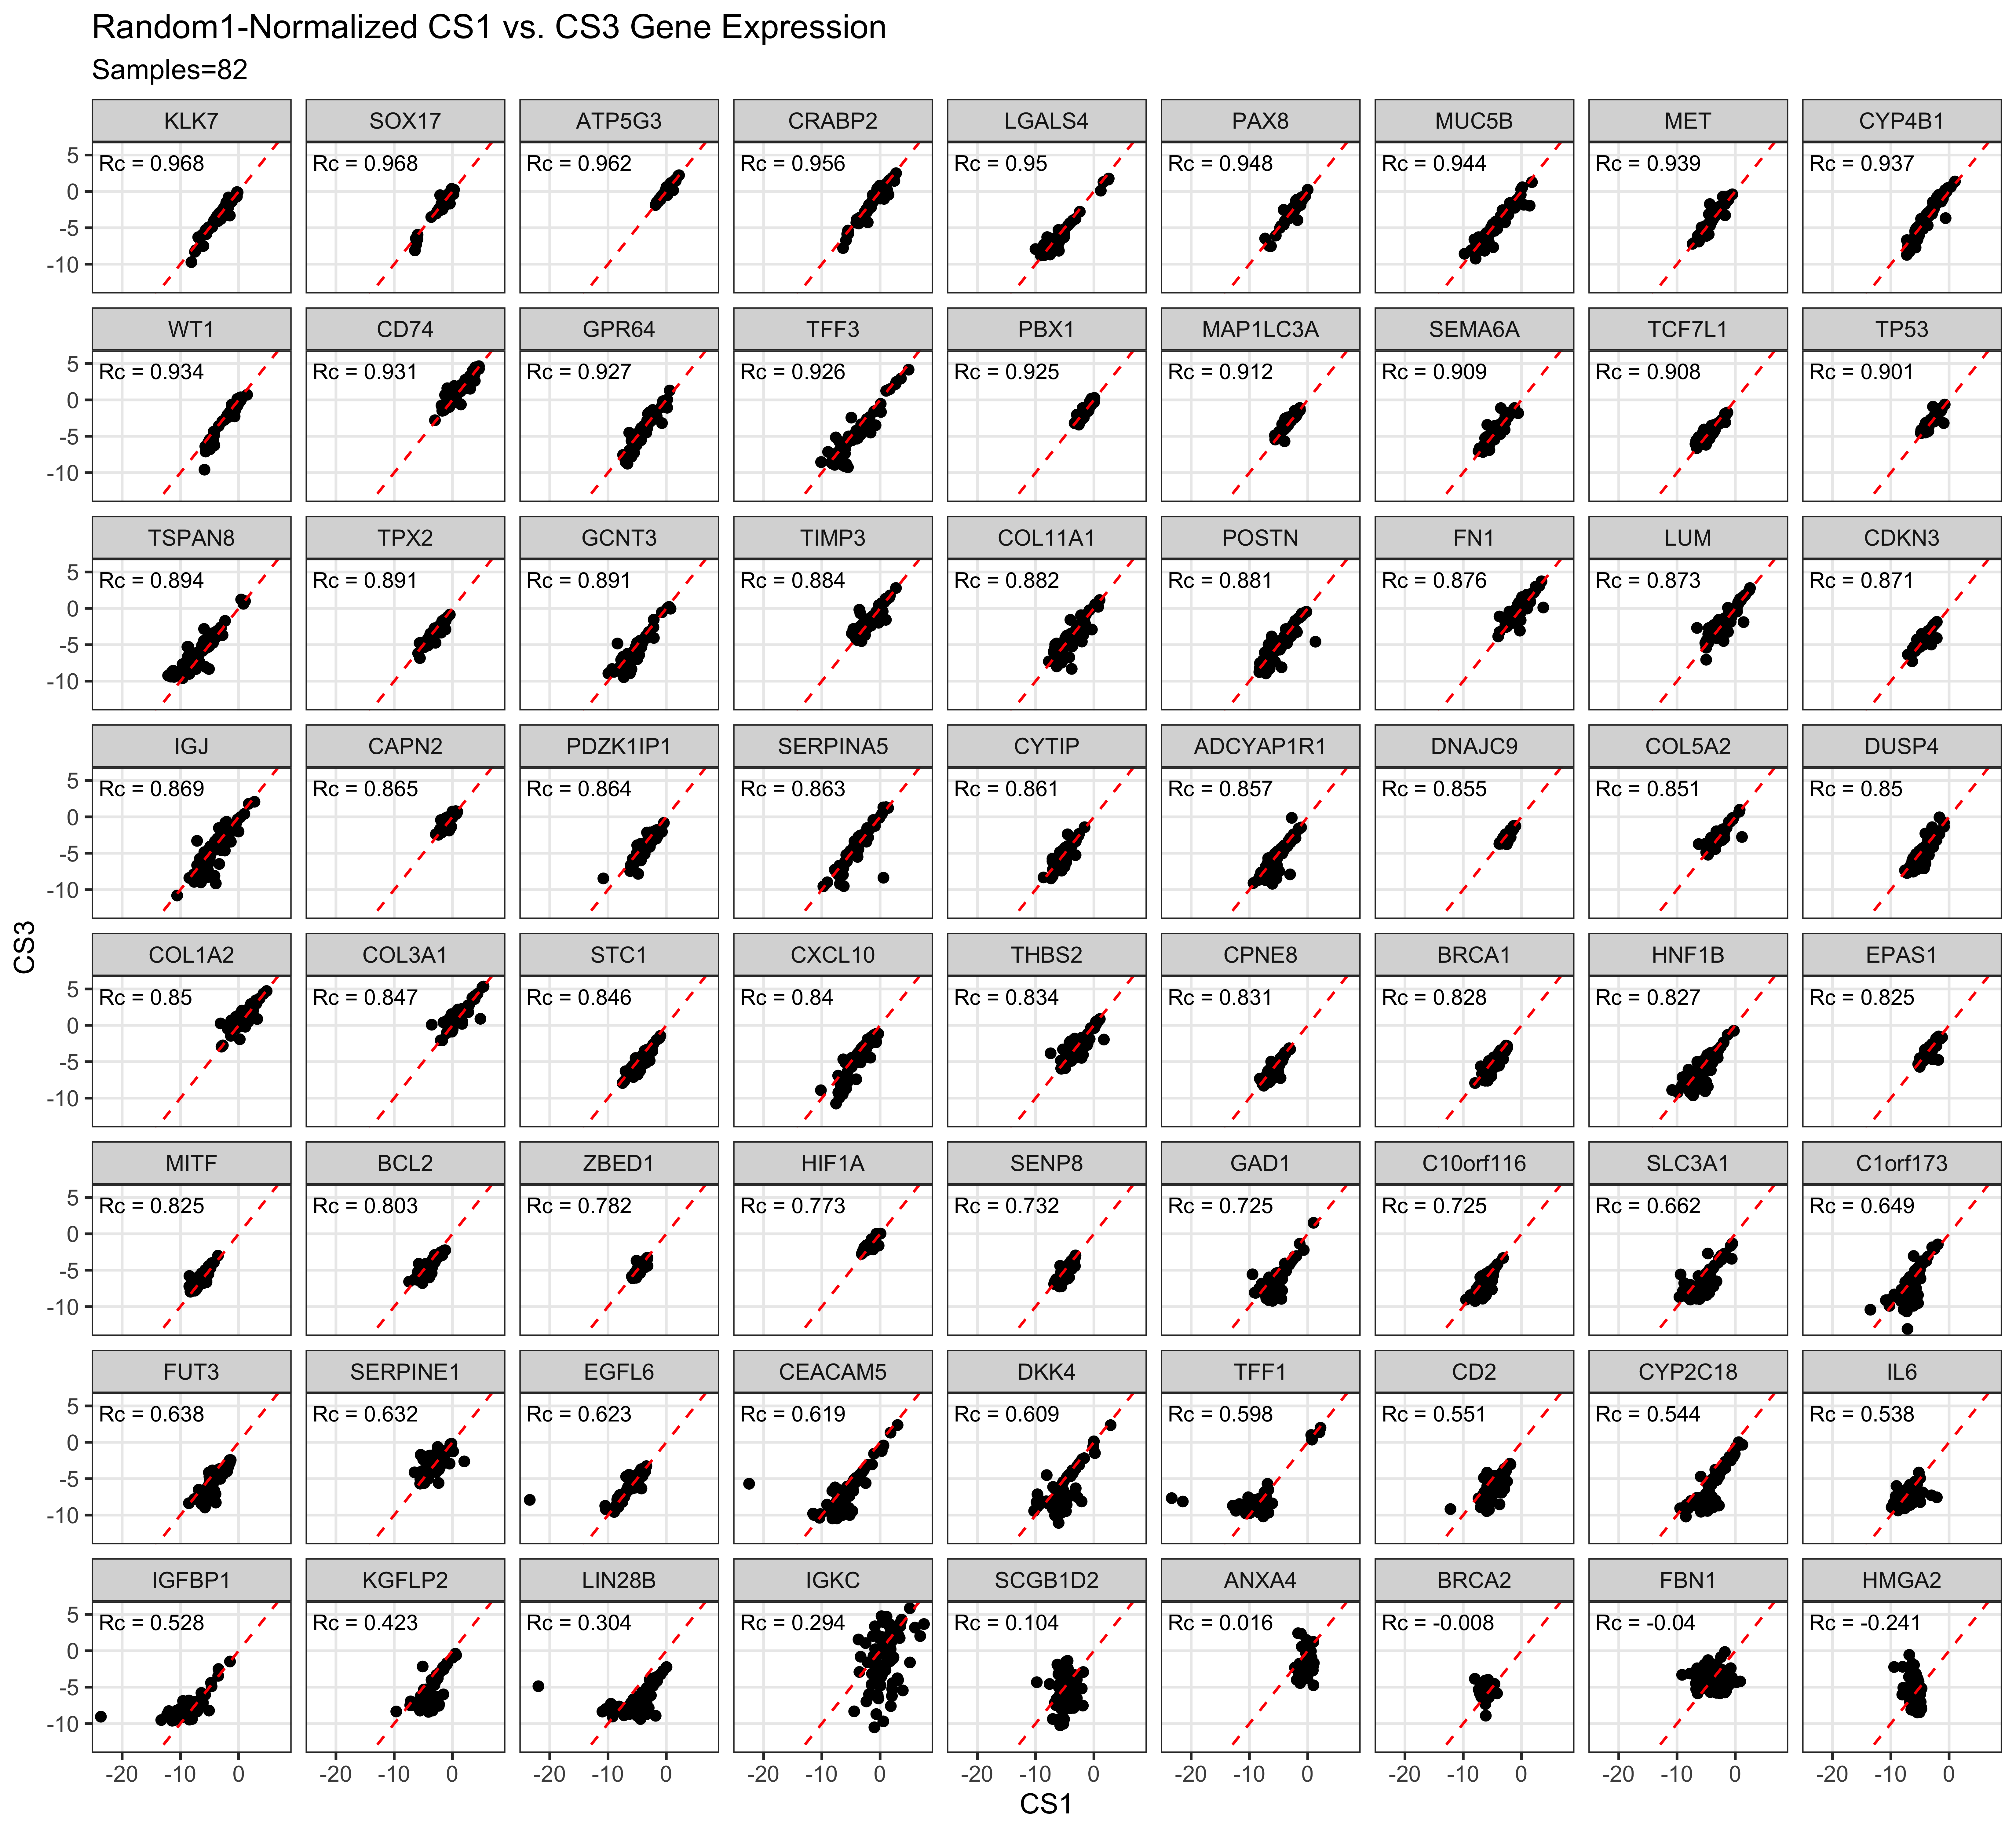
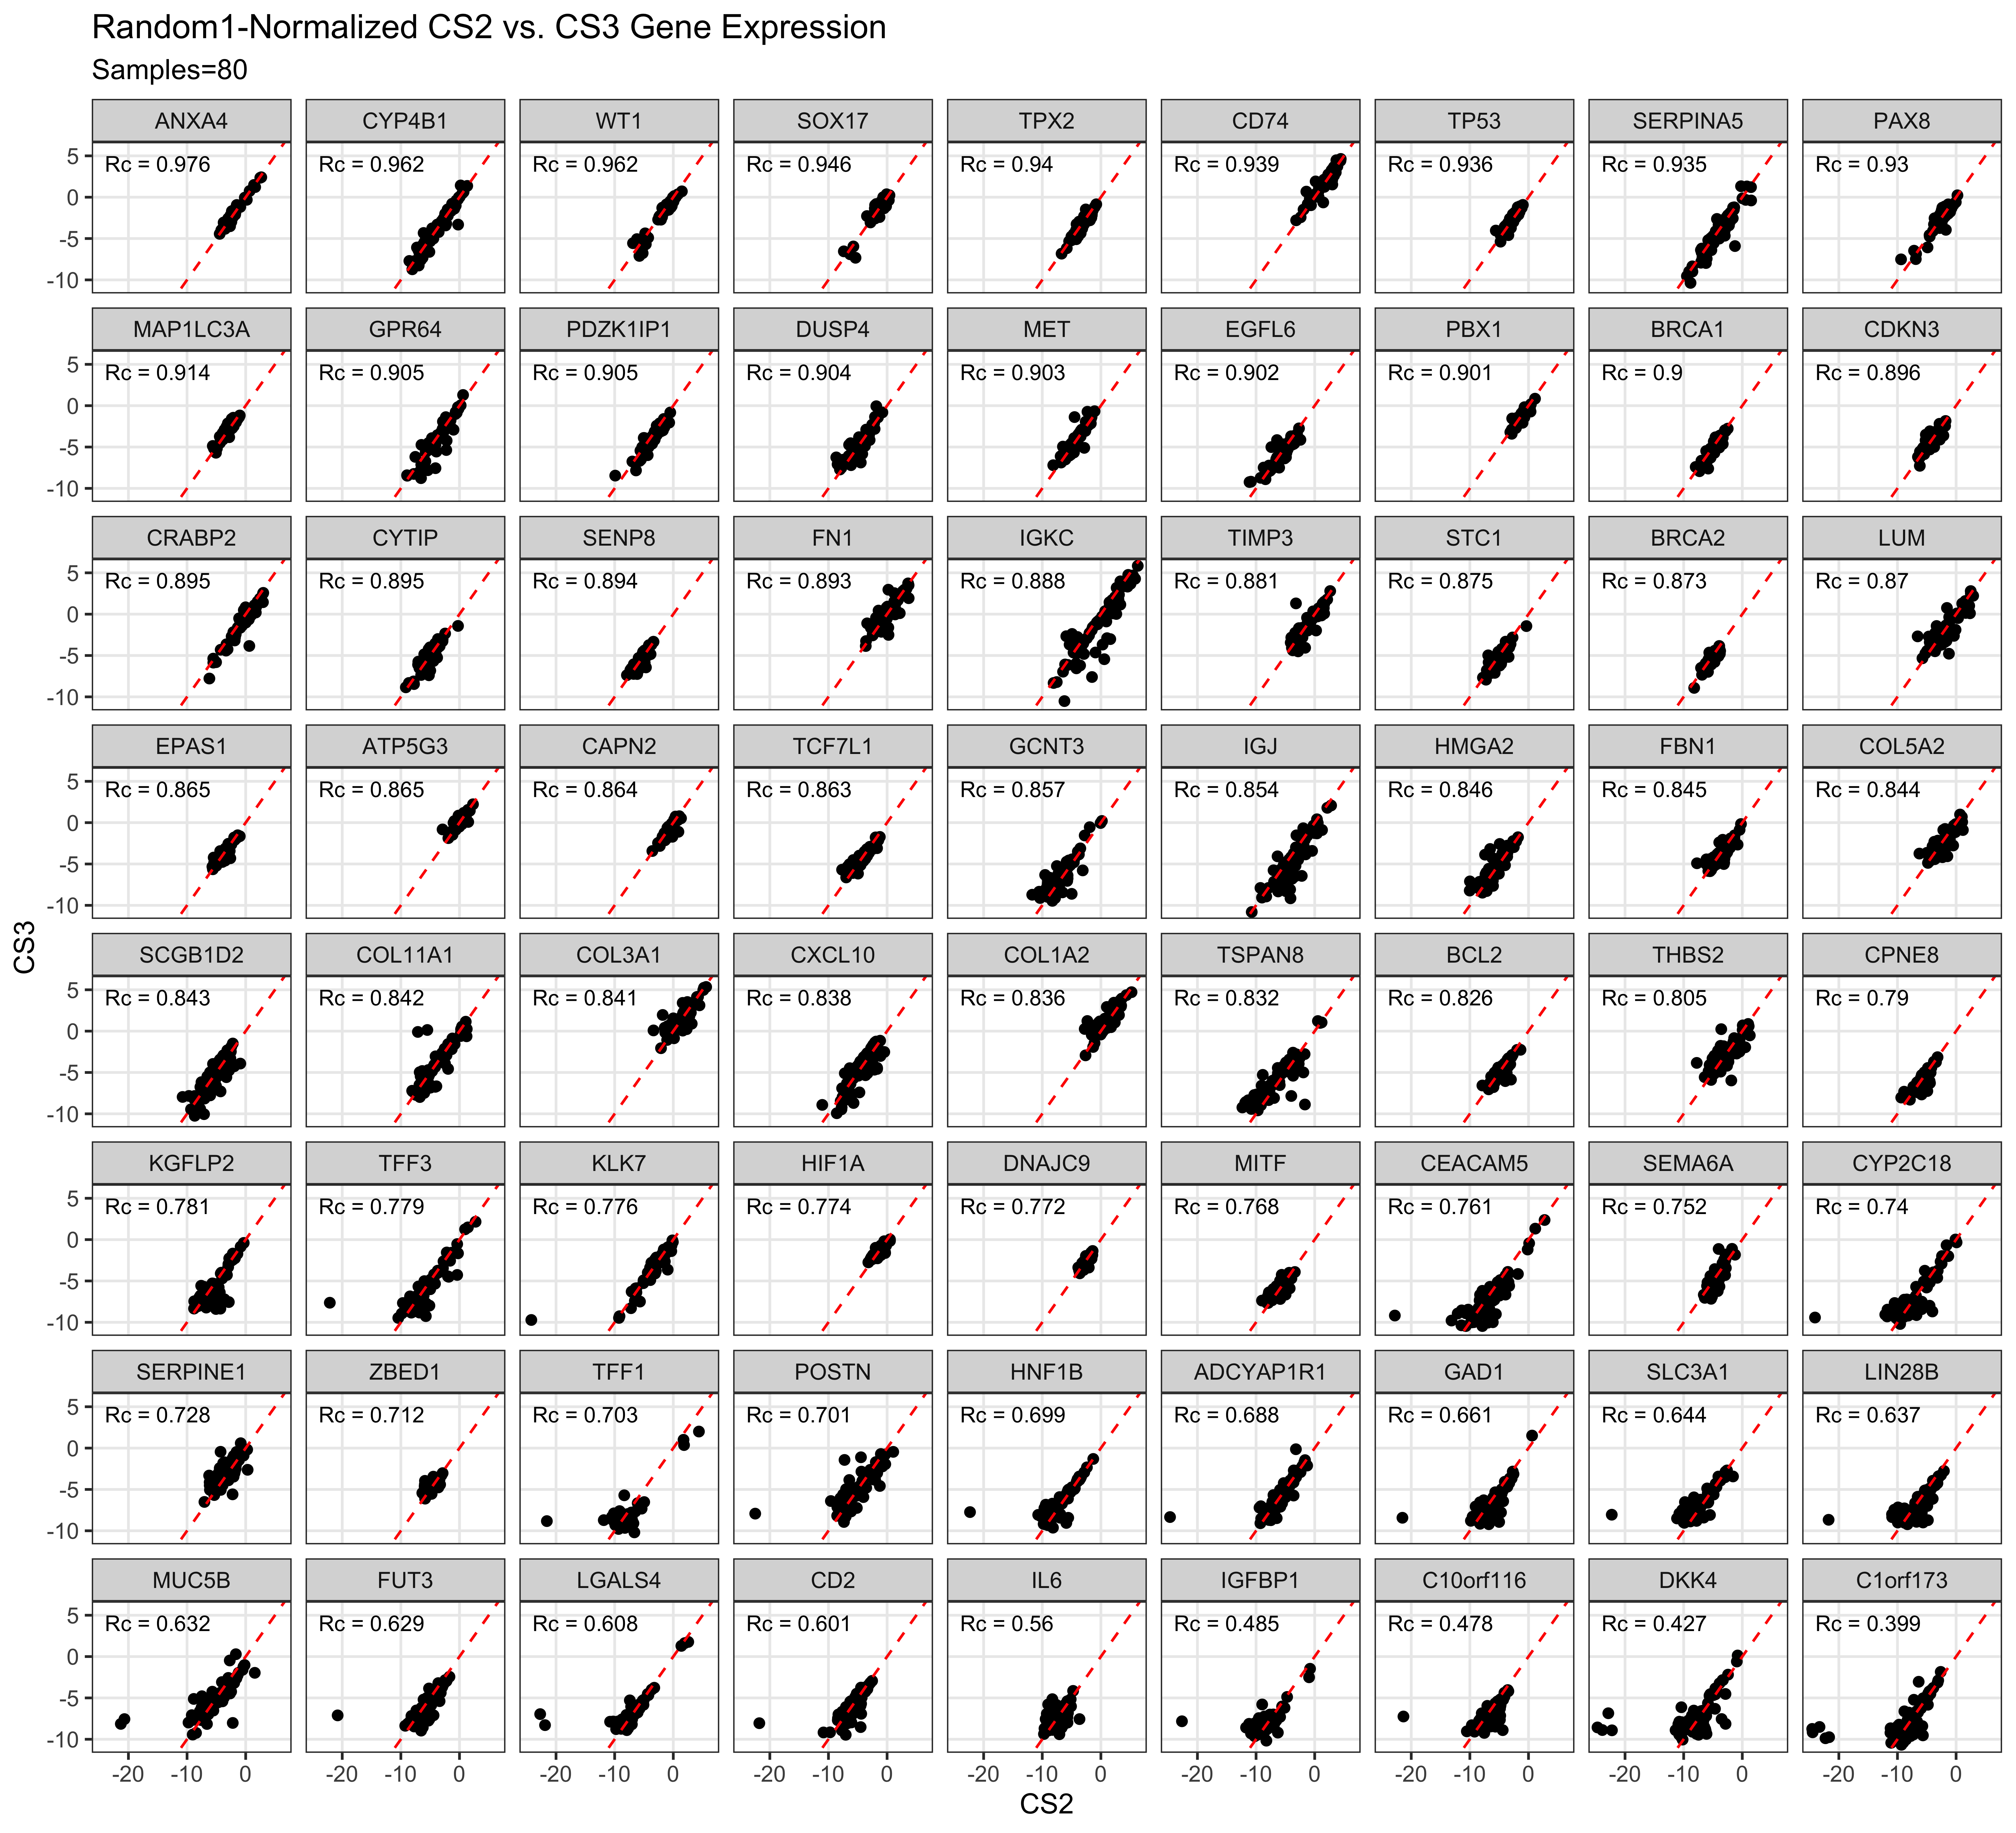
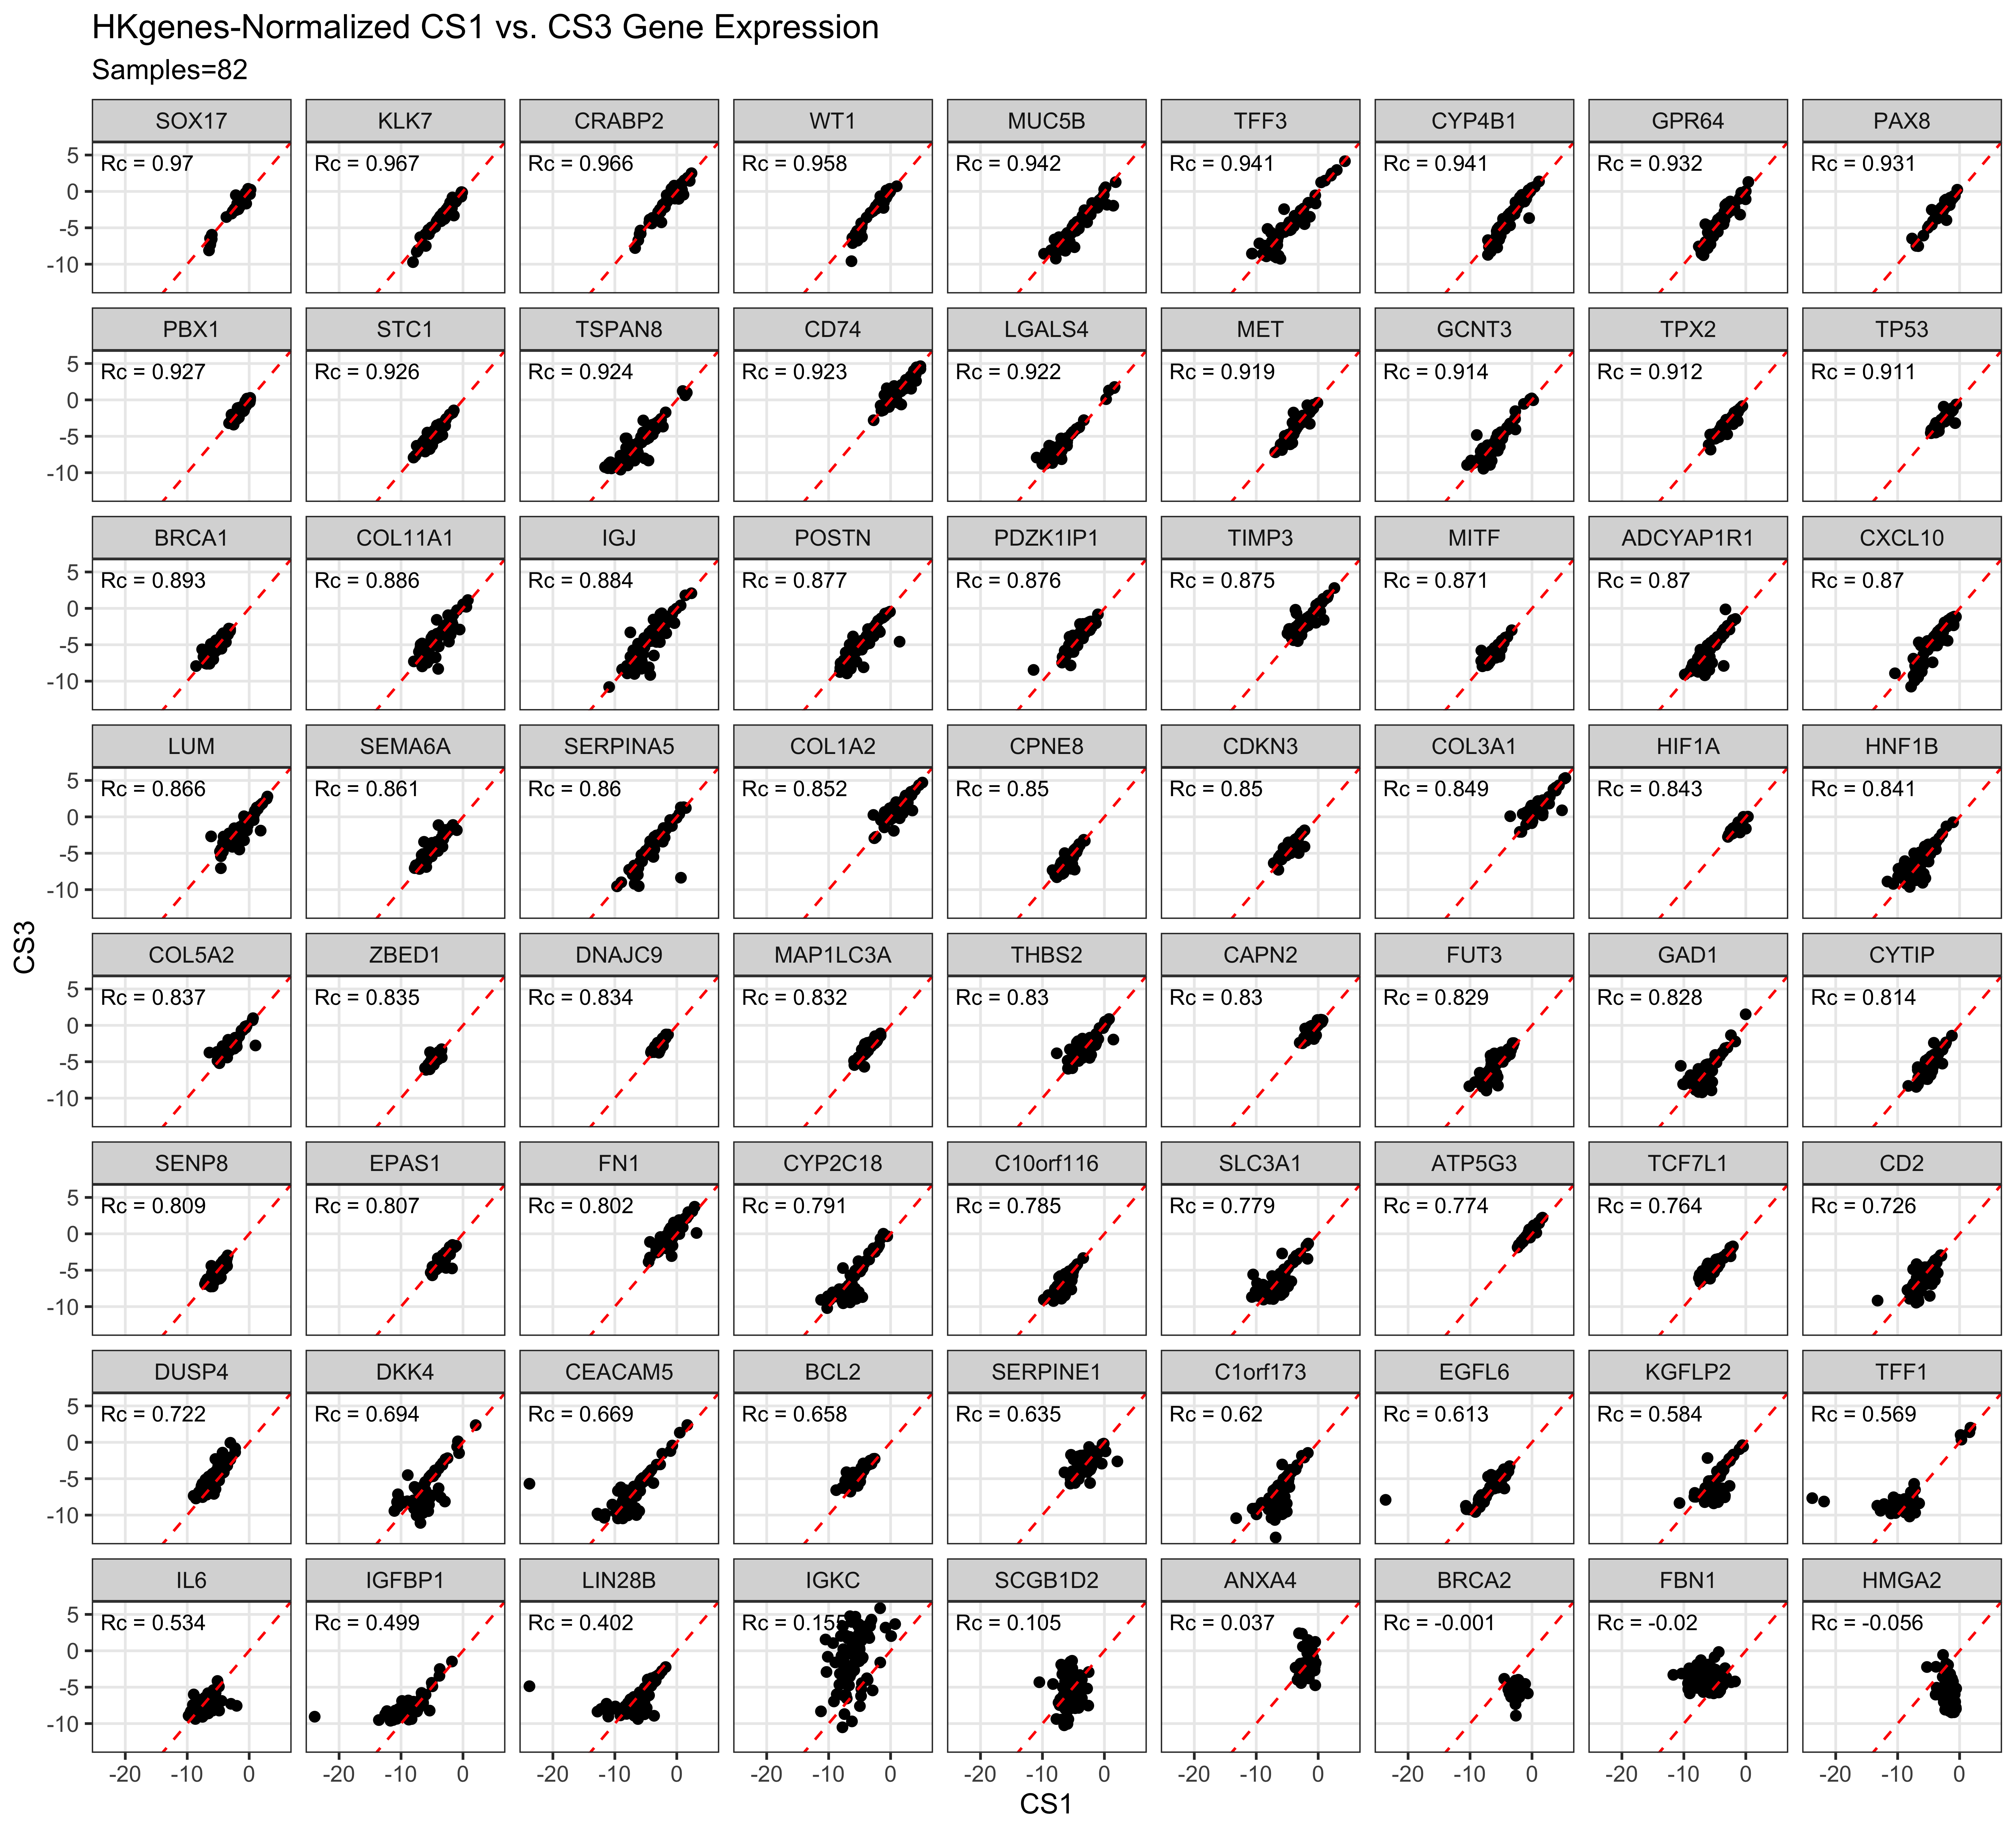
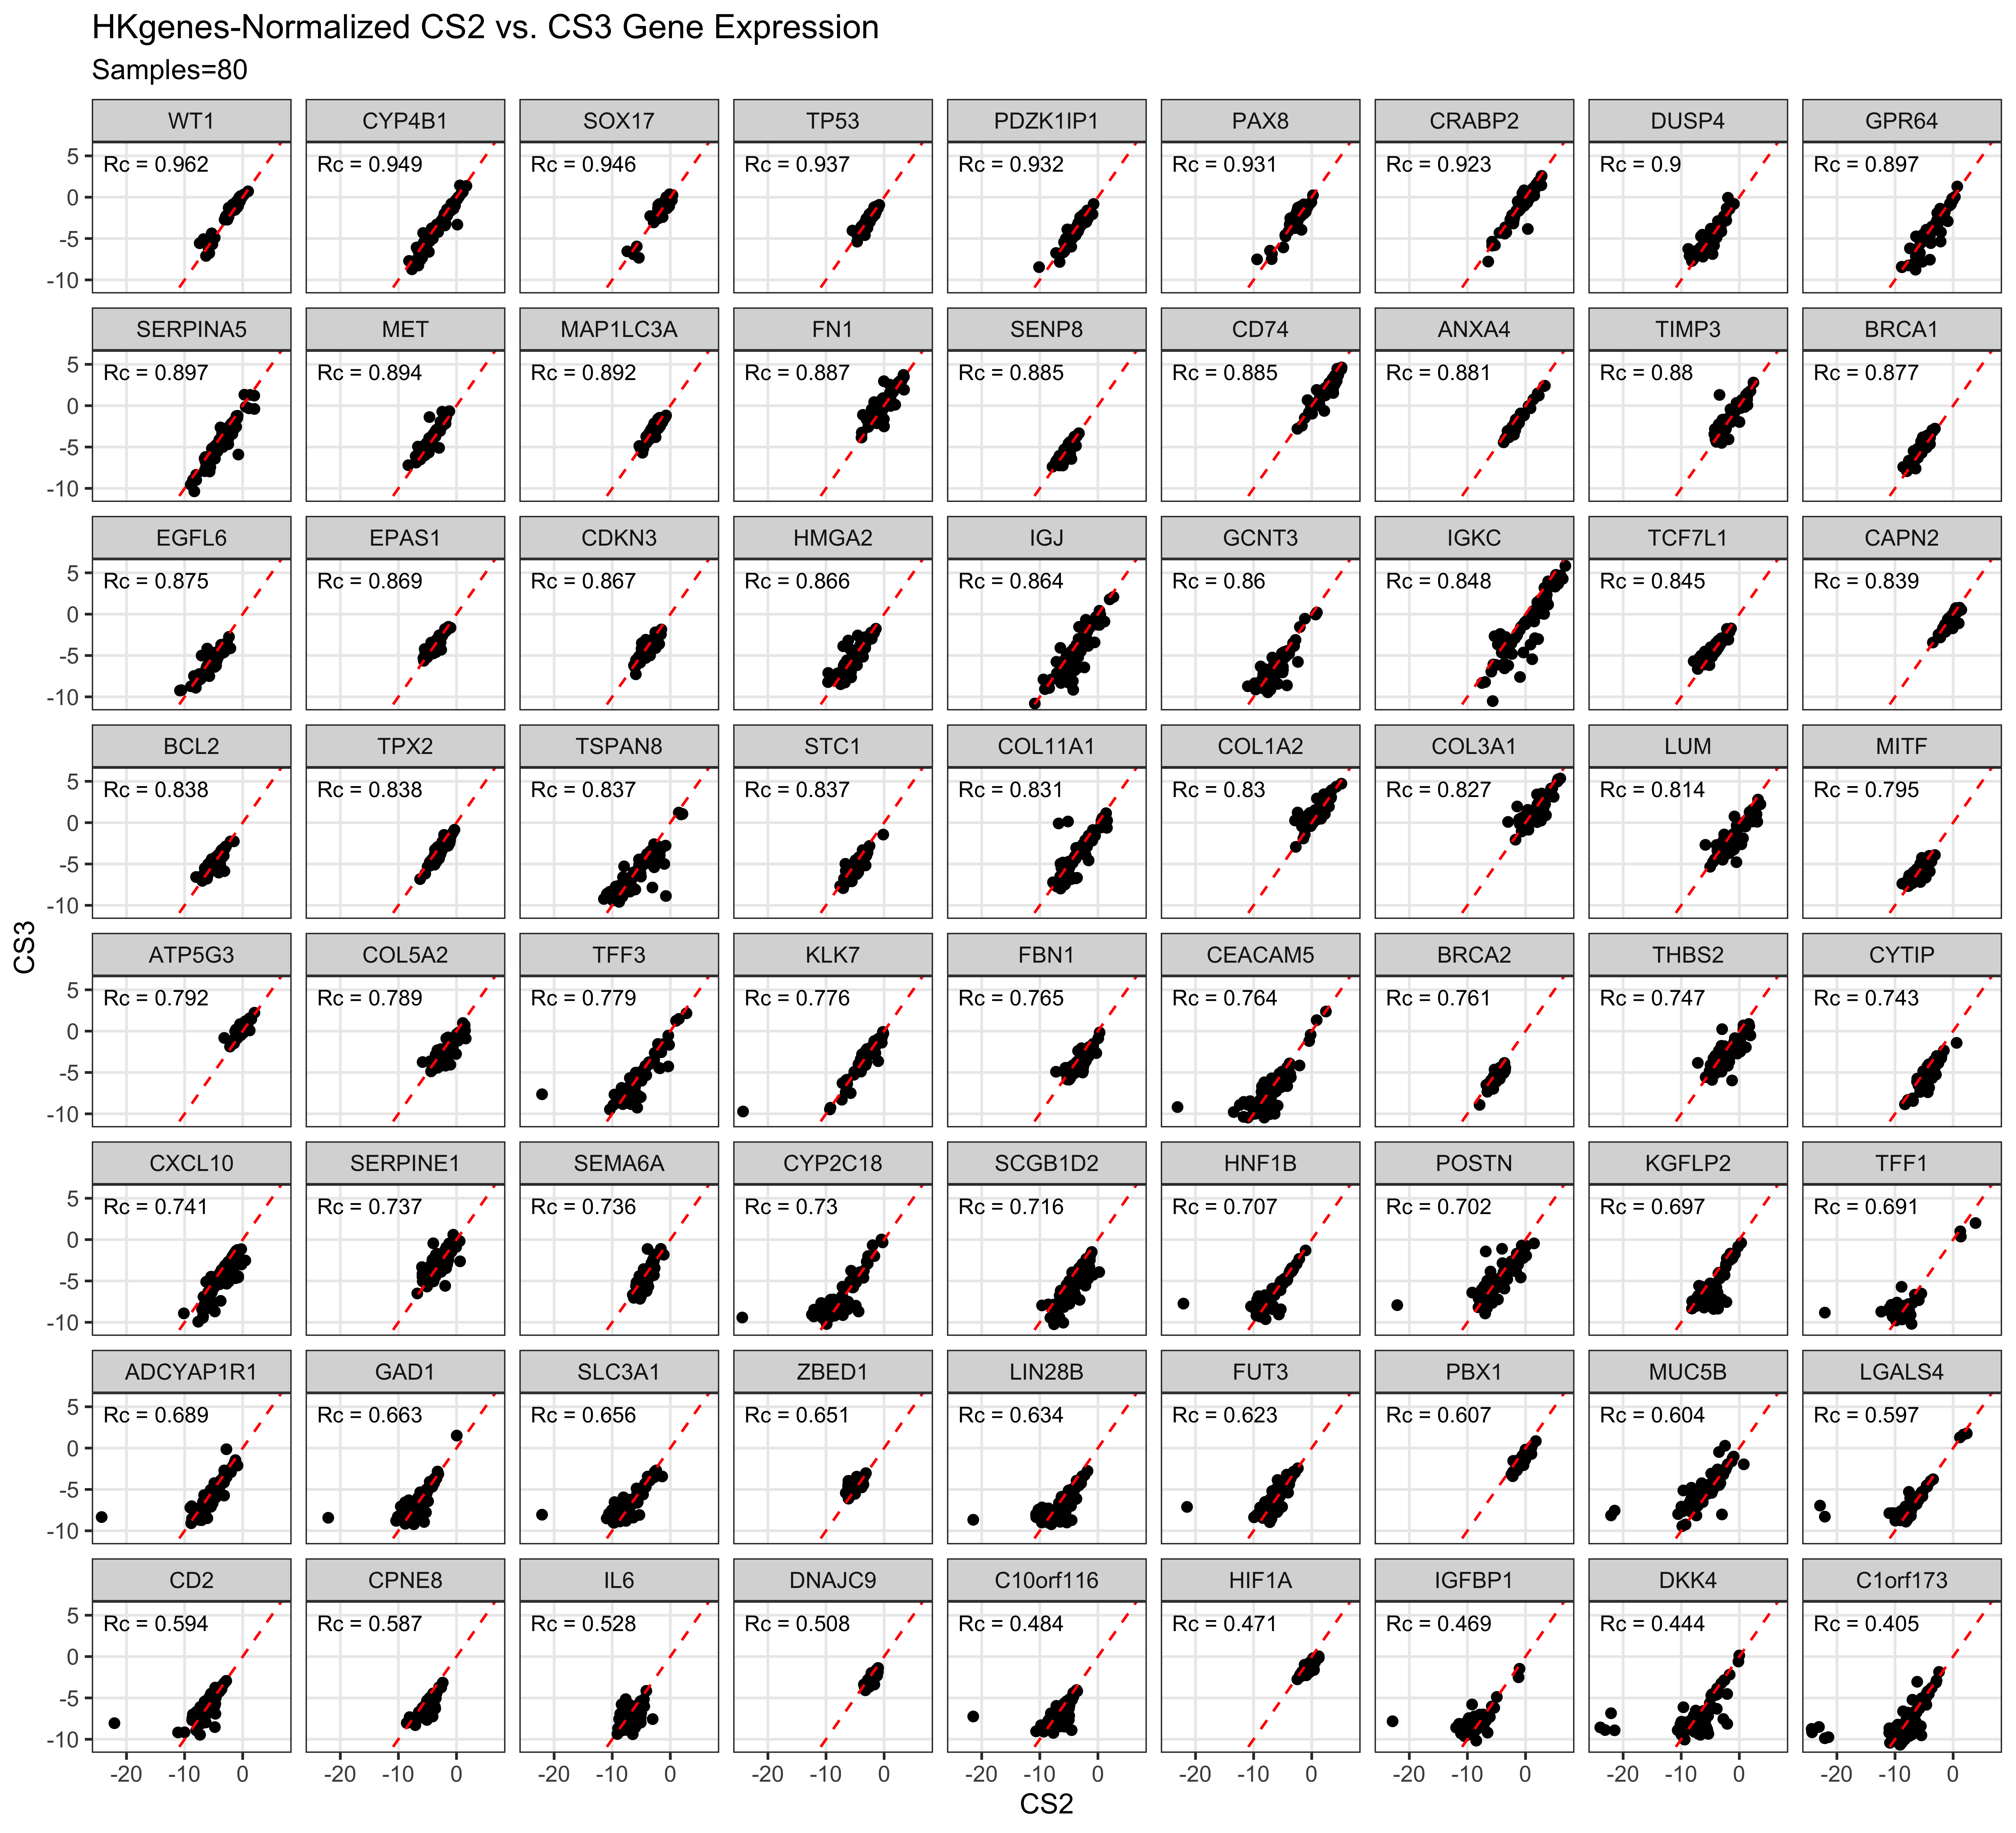
| Correlation | Housekeeping Genes N = 721 |
Random1 N = 721 |
p-value2 |
|---|---|---|---|
| CS1 vs. CS3 | 0.84 (0.74, 0.90) | 0.84 (0.67, 0.89) | 0.079 |
| CS2 vs. CS3 | 0.80 (0.69, 0.88) | 0.84 (0.72, 0.88) | 0.003 |
| 1 Median (Q1, Q3) | |||
| 2 Wilcoxon signed rank test with continuity correction | |||